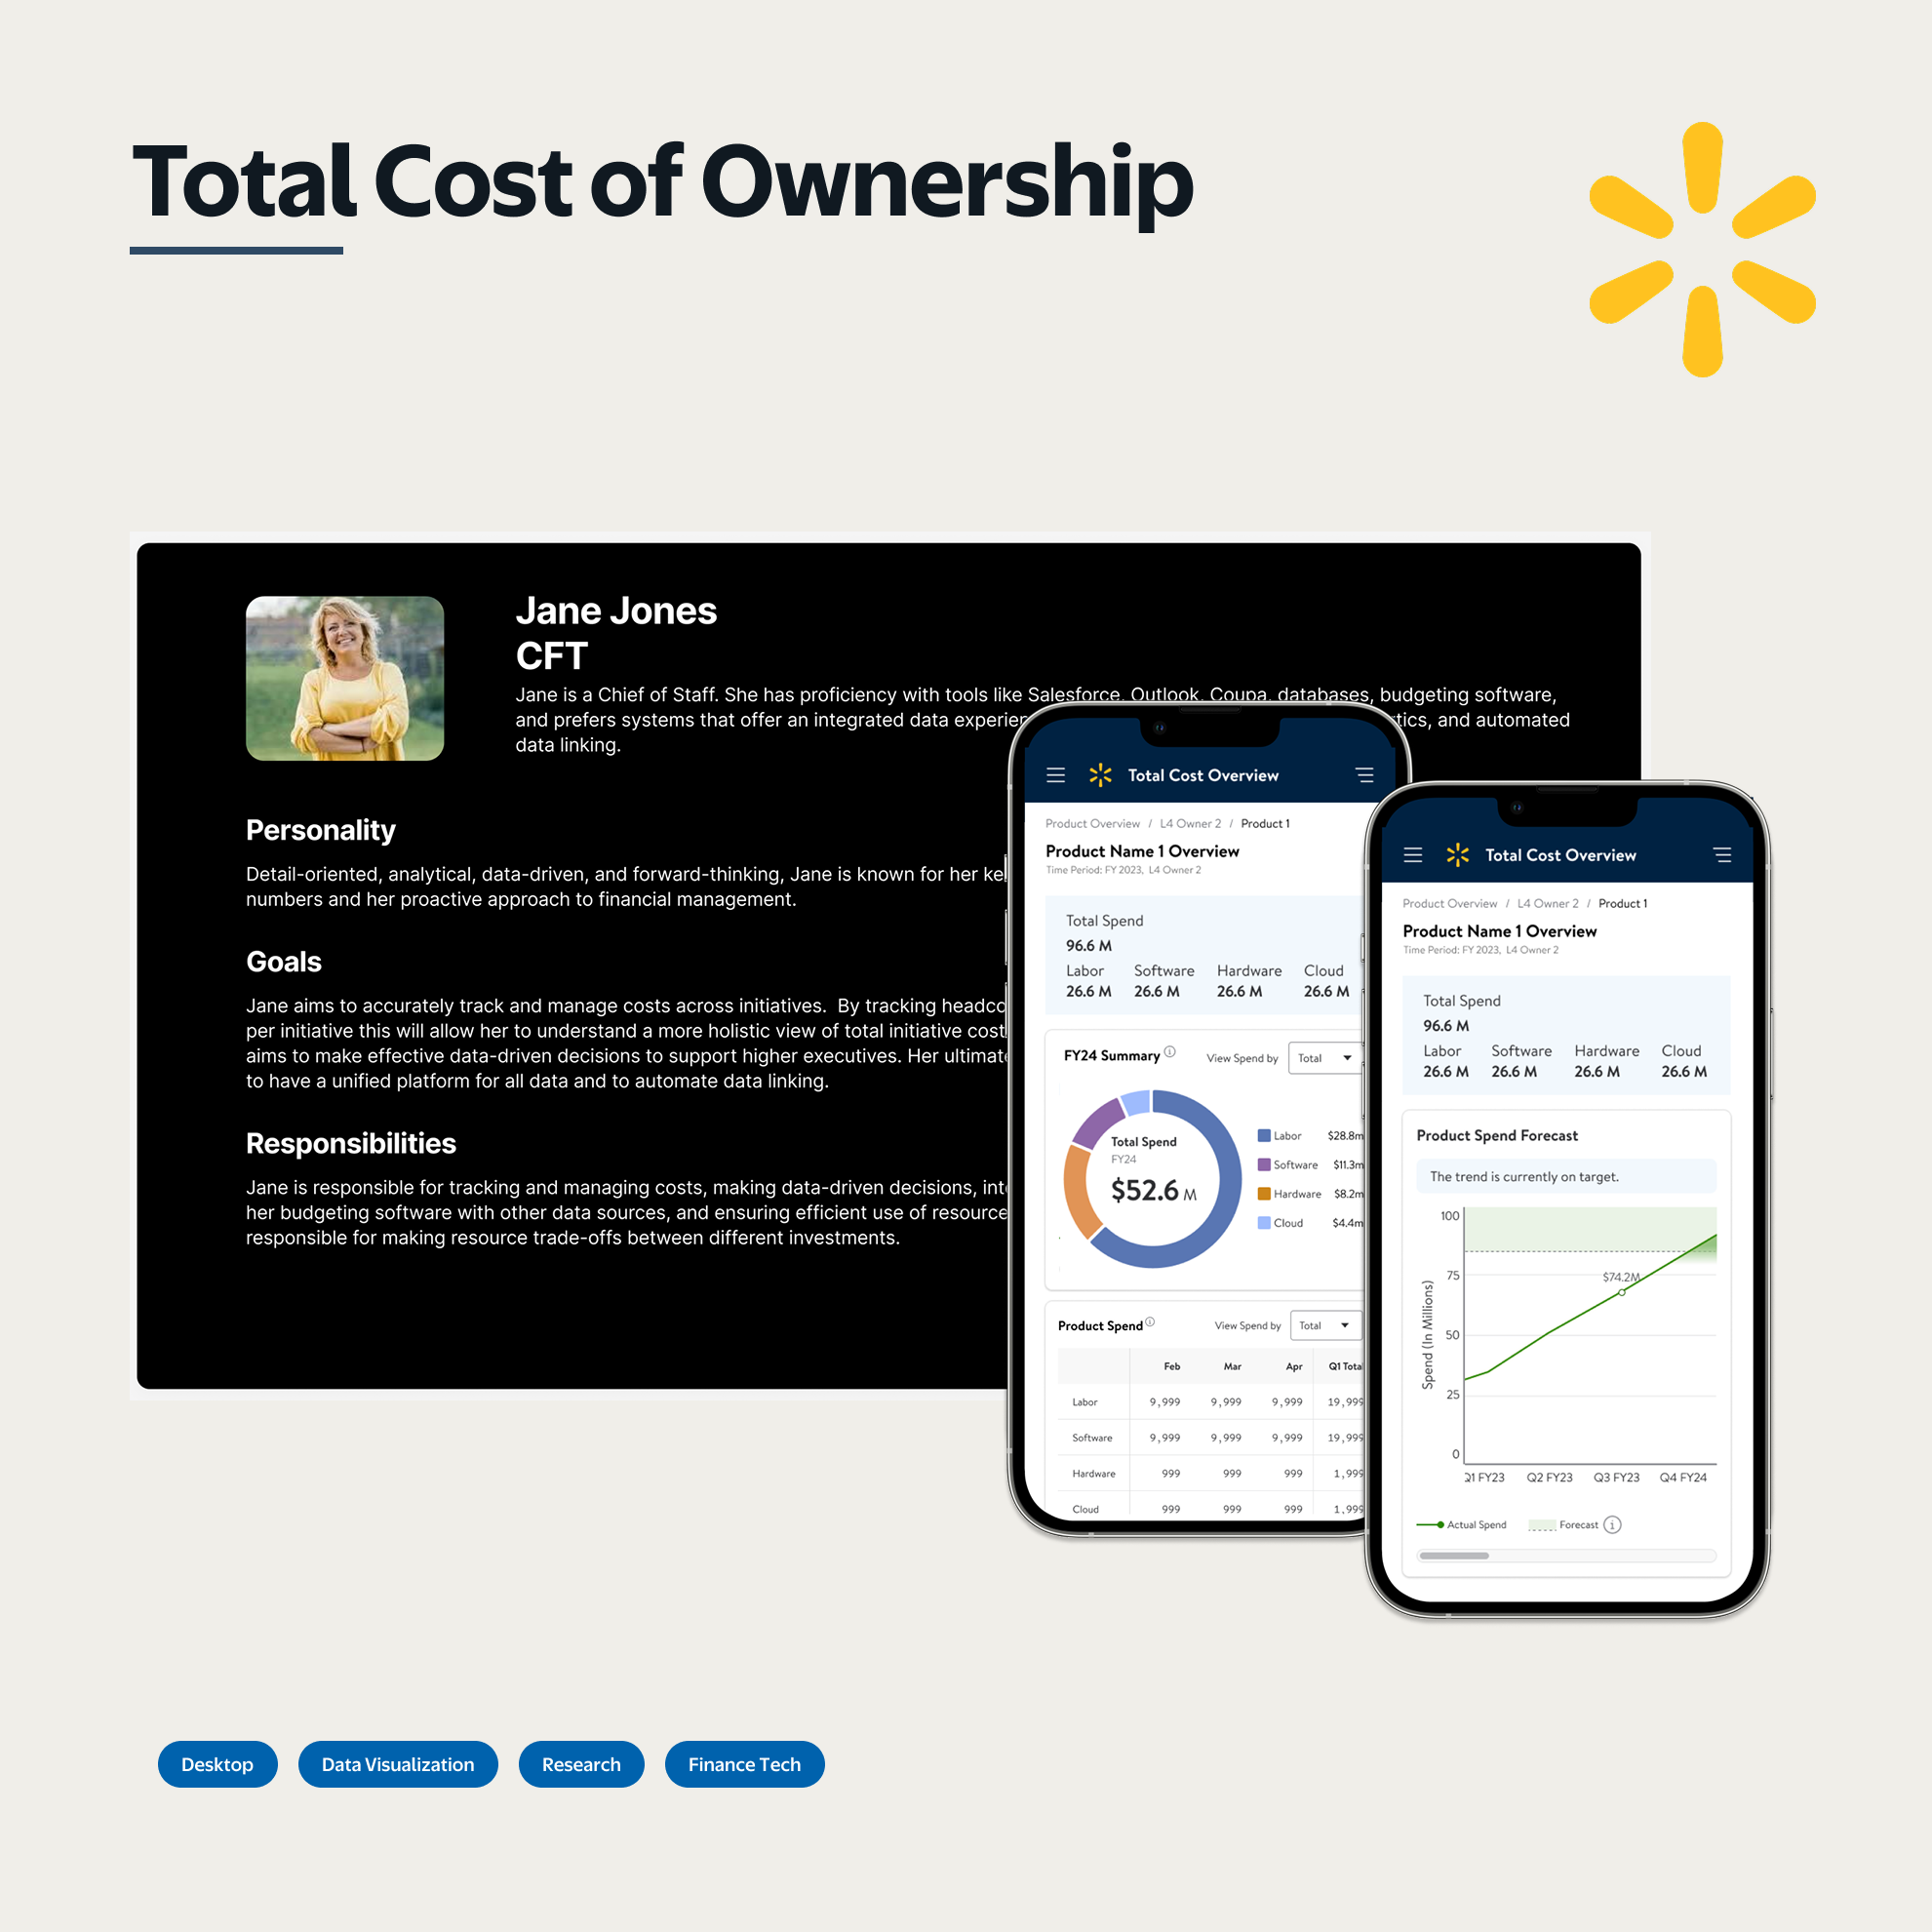
Walmart Global Tech had 3.67 million monthly cost records across multiple systems and no coherent view of what any of it meant. Investment decisions were being made without reliable cost transparency — technology spend was happening faster than the reporting could follow it. The core research finding: finance leaders think about spend by product area and initiative, not by the data categories the systems used to store it. That gap was the whole problem.
Research also surfaced that trend visibility was the highest-value need (not point-in-time data), and that manual compilation was consuming significant time every reporting cycle for no analytical gain. Five dashboards addressed all three: organized around product area and initiative, with trend as a first-class view, and data surfaced automatically rather than assembled by hand.
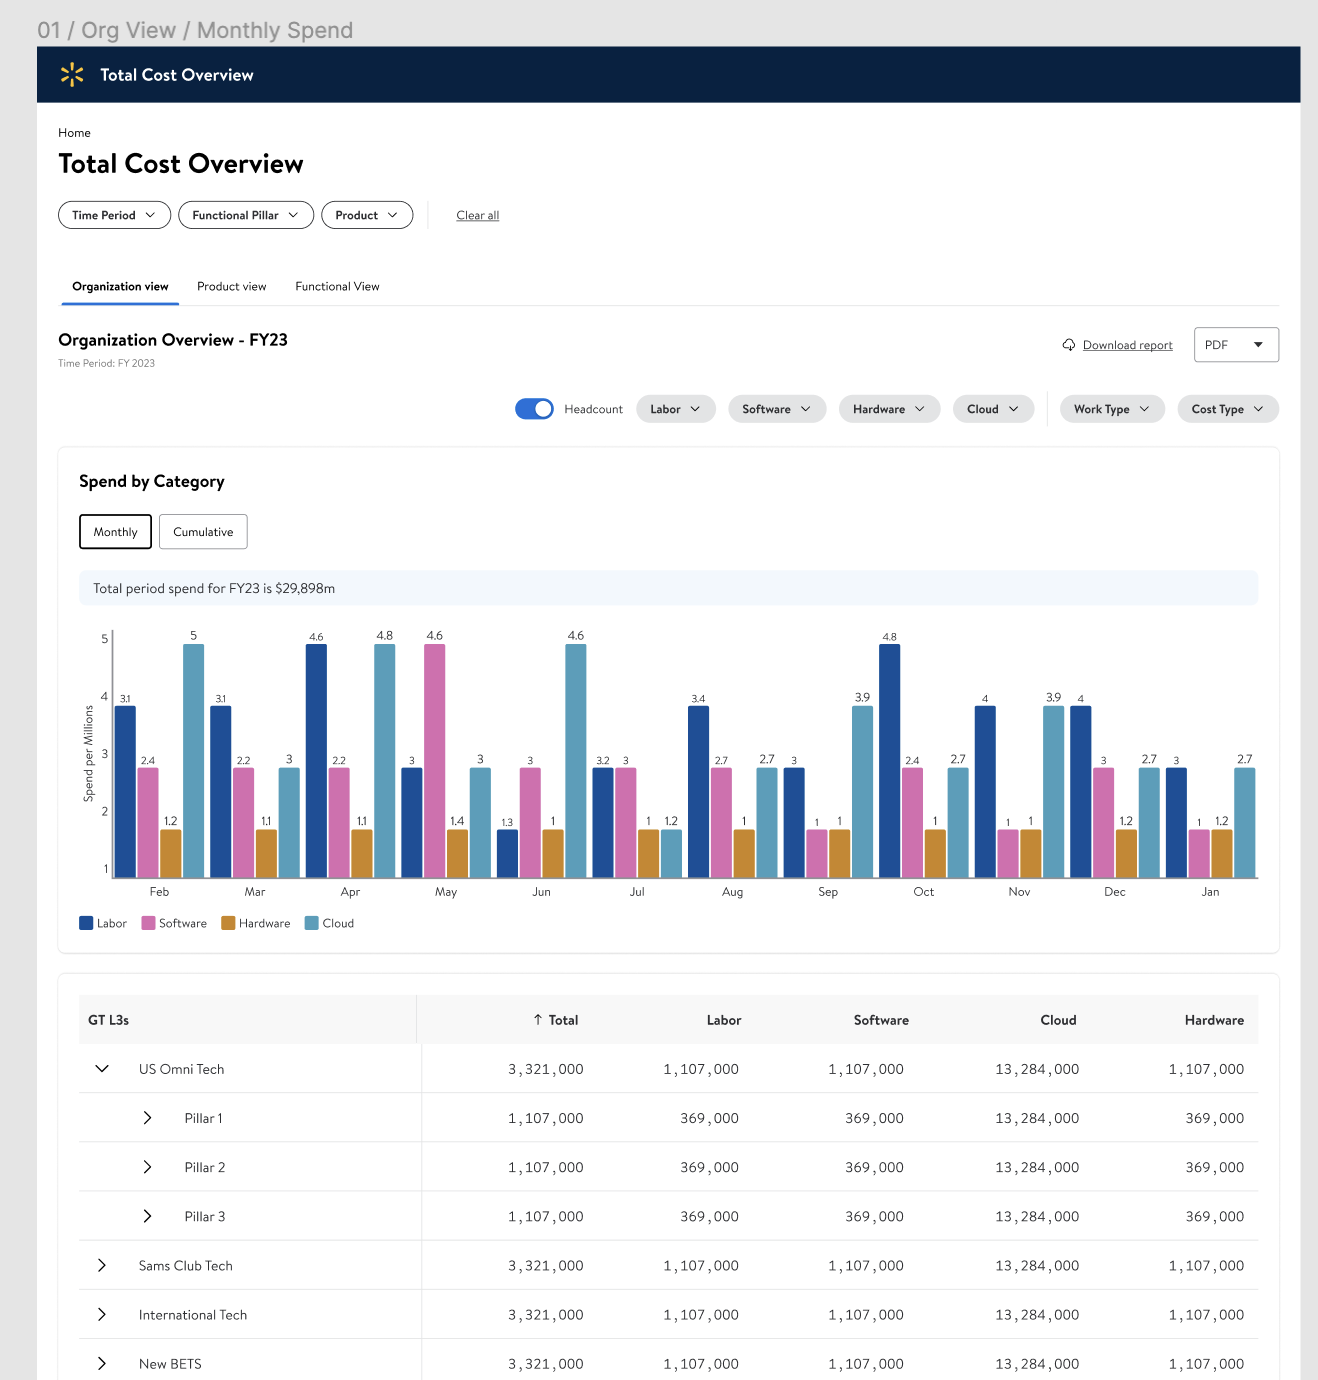
Five dashboards shipped at soft launch to 35 financial planning users. Decision-makers got the cost visibility to make informed investment decisions without manually assembling reports at the start of each reporting cycle.
Research identified the organizing principle: finance leaders think about spend by product area and initiative, not by data category. That single insight drove the entire IA — five dashboards built around decision-making patterns rather than system architecture. Manual report compilation for 35 planning users at the start of each cycle became unnecessary.