The problem
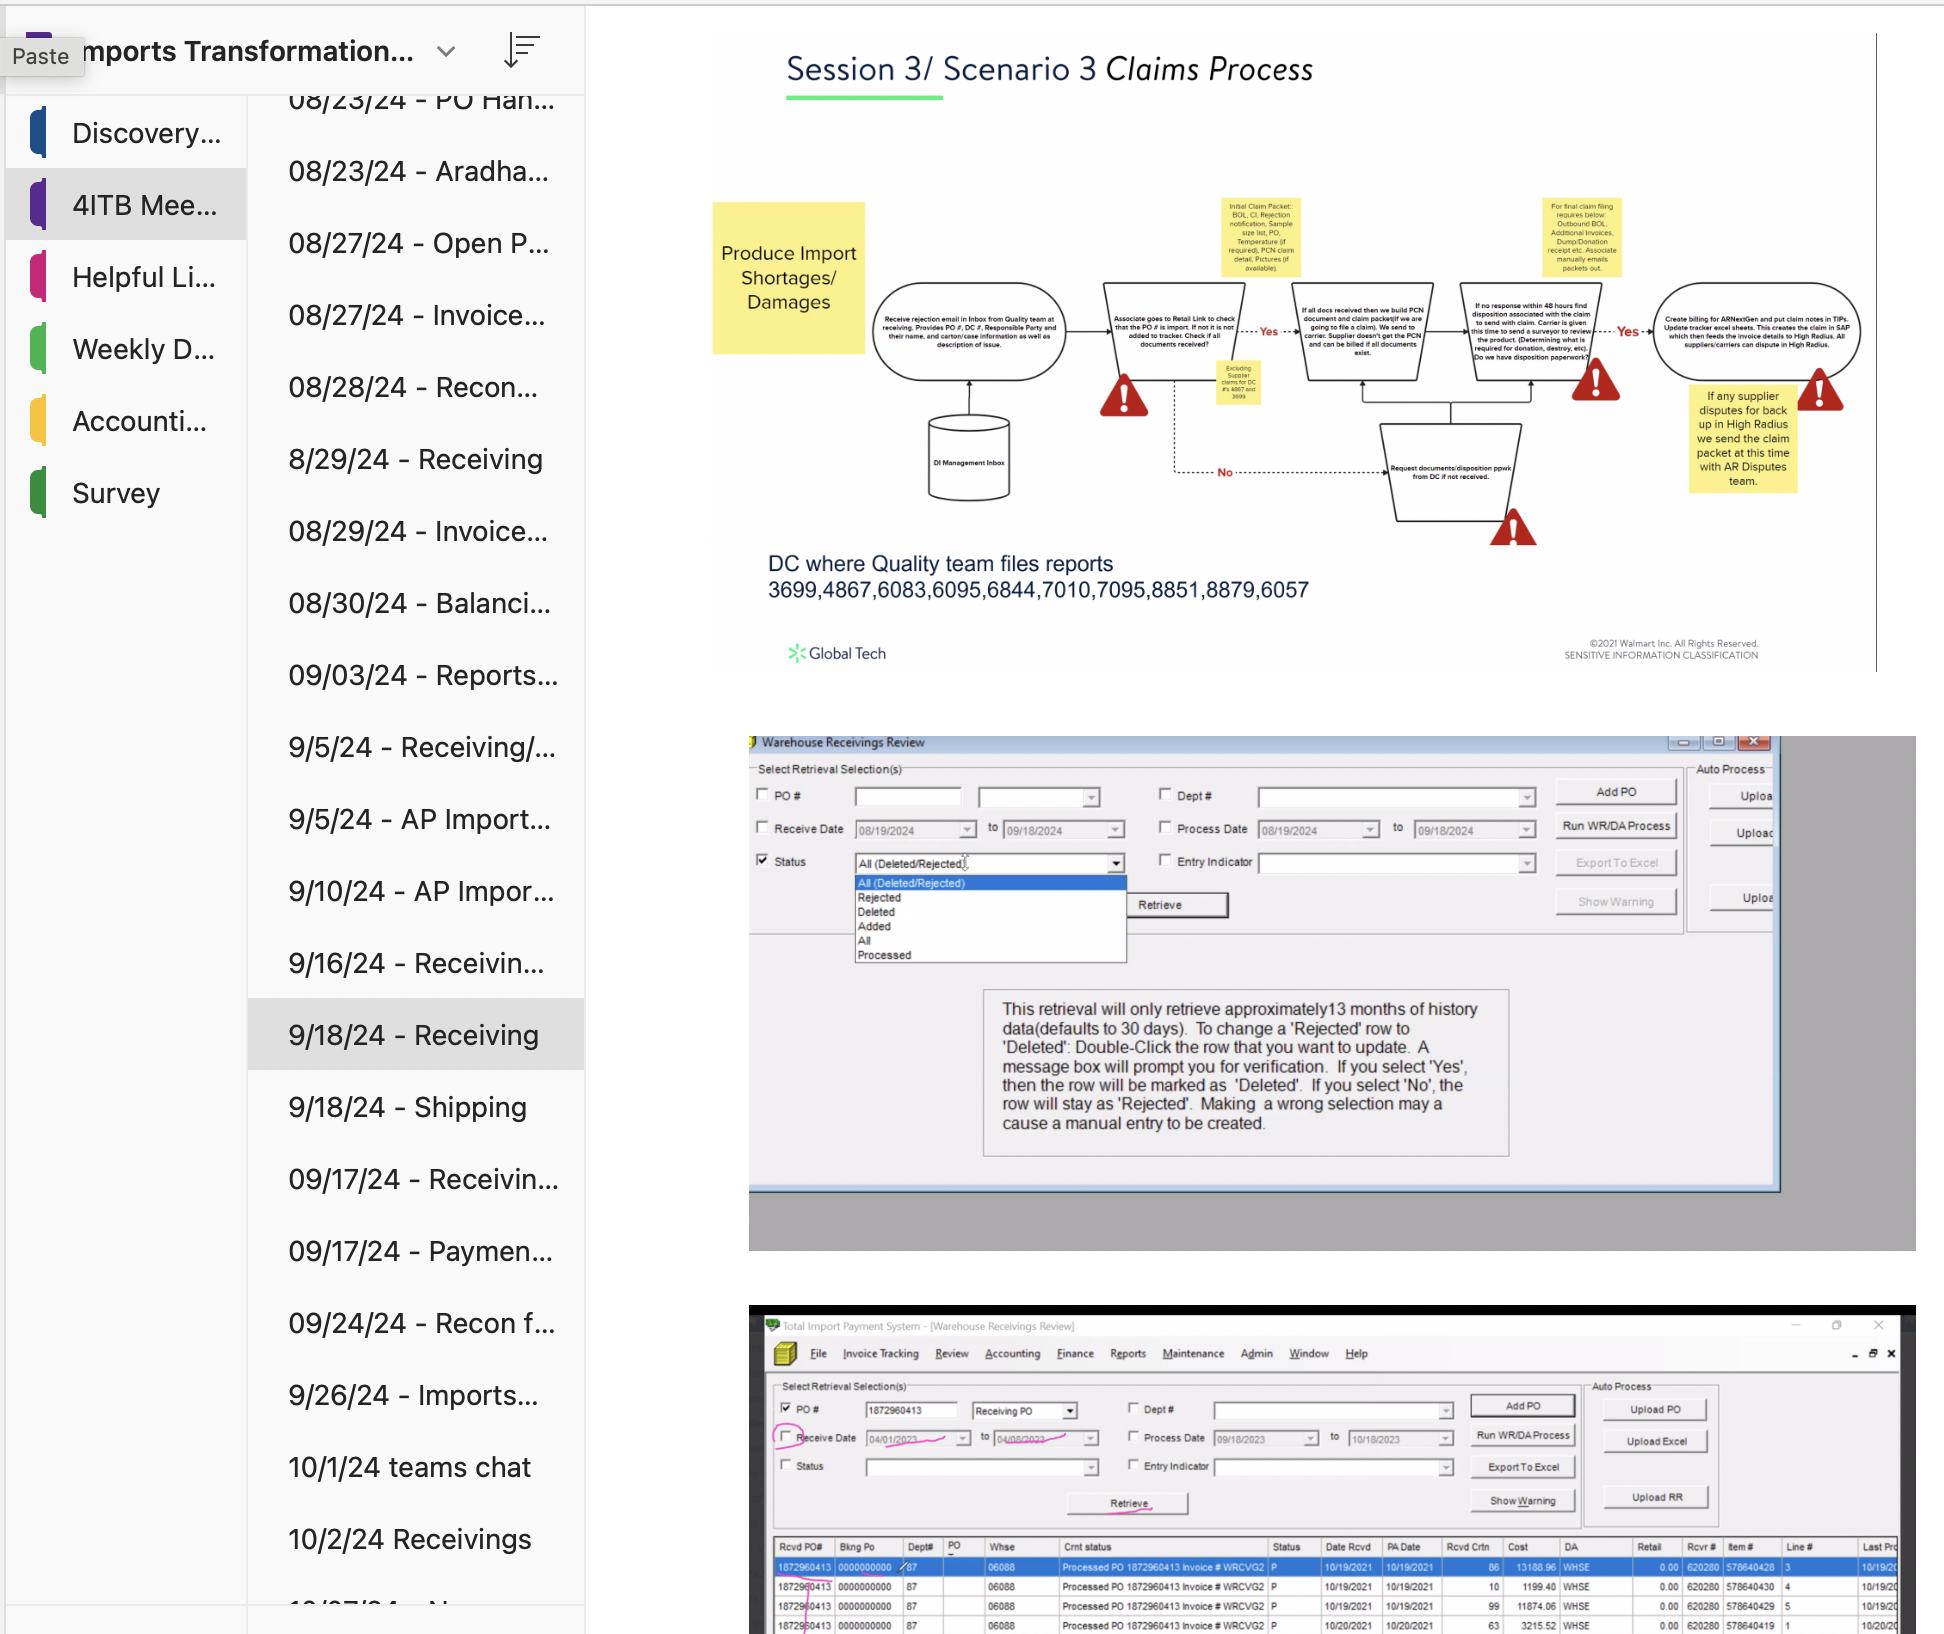
Finance analysts and procurement buyers had quietly built shadow systems around their primary tool — spreadsheets, manual checklists, workarounds that lived entirely outside the platform. No escalations on record. Everyone had simply adapted.
The workarounds had become invisible to the business. That adaptation was the real problem — not just a usability issue, but a business cost. The tool wasn't losing users. It was losing volume.
"We would get more import business if Walmart made this simpler."
An external supplier, unprompted, during discovery research. The UX problem was costing the business volume, not just user time.
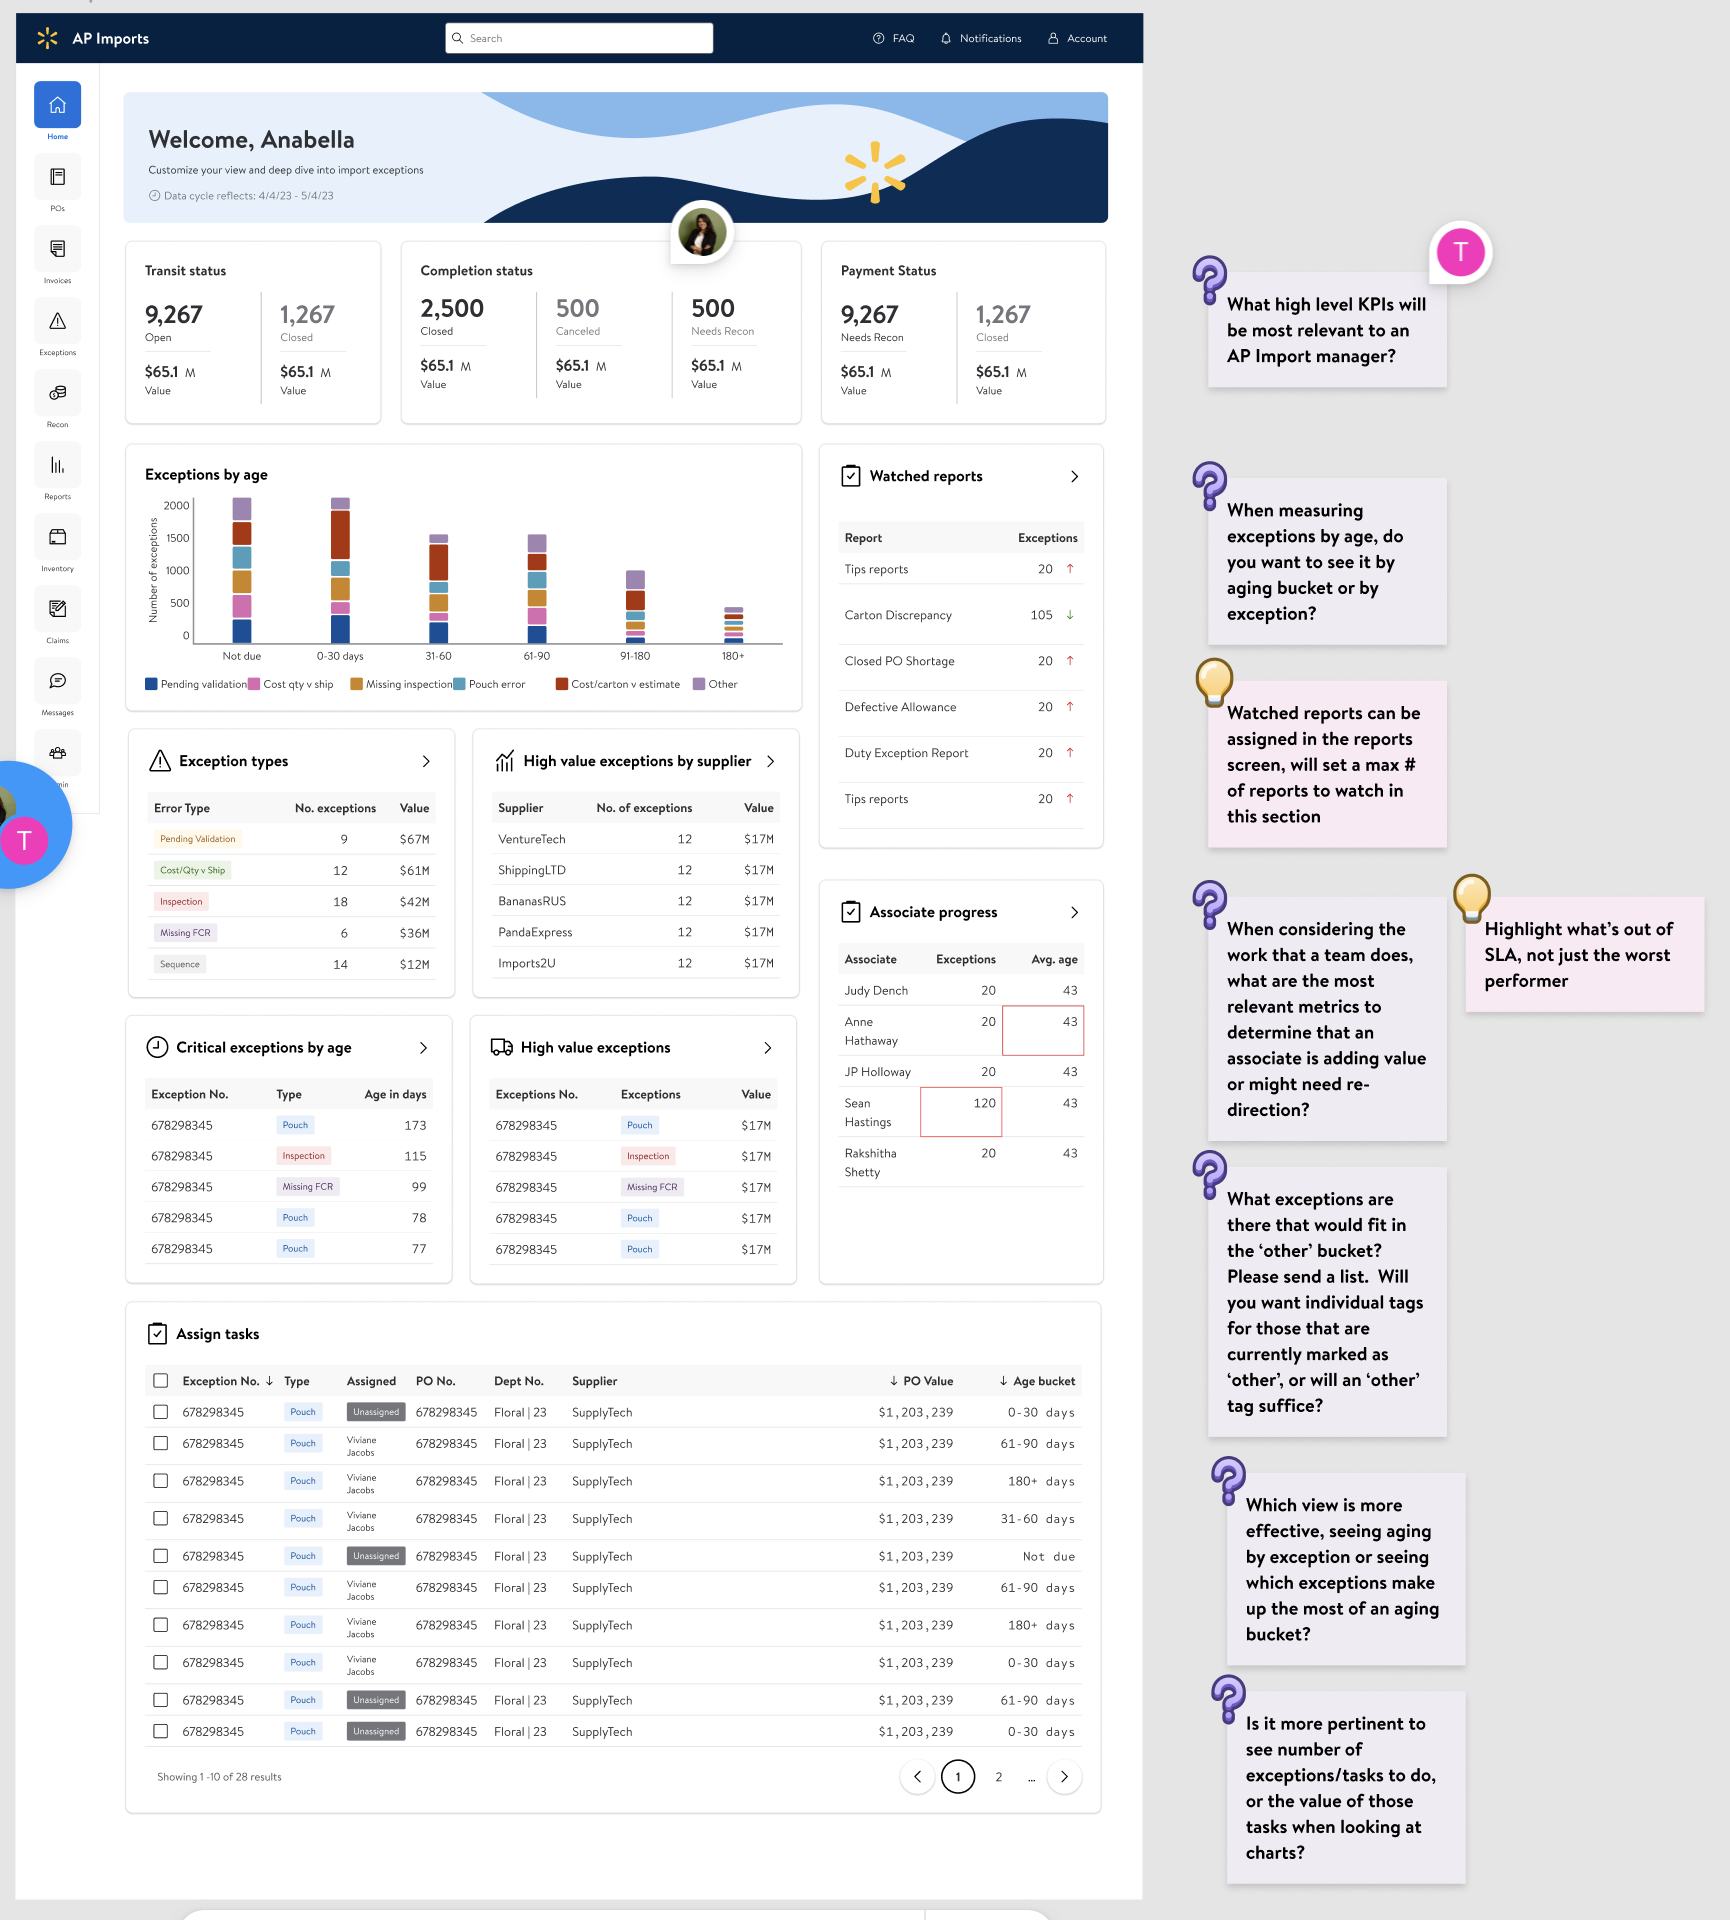
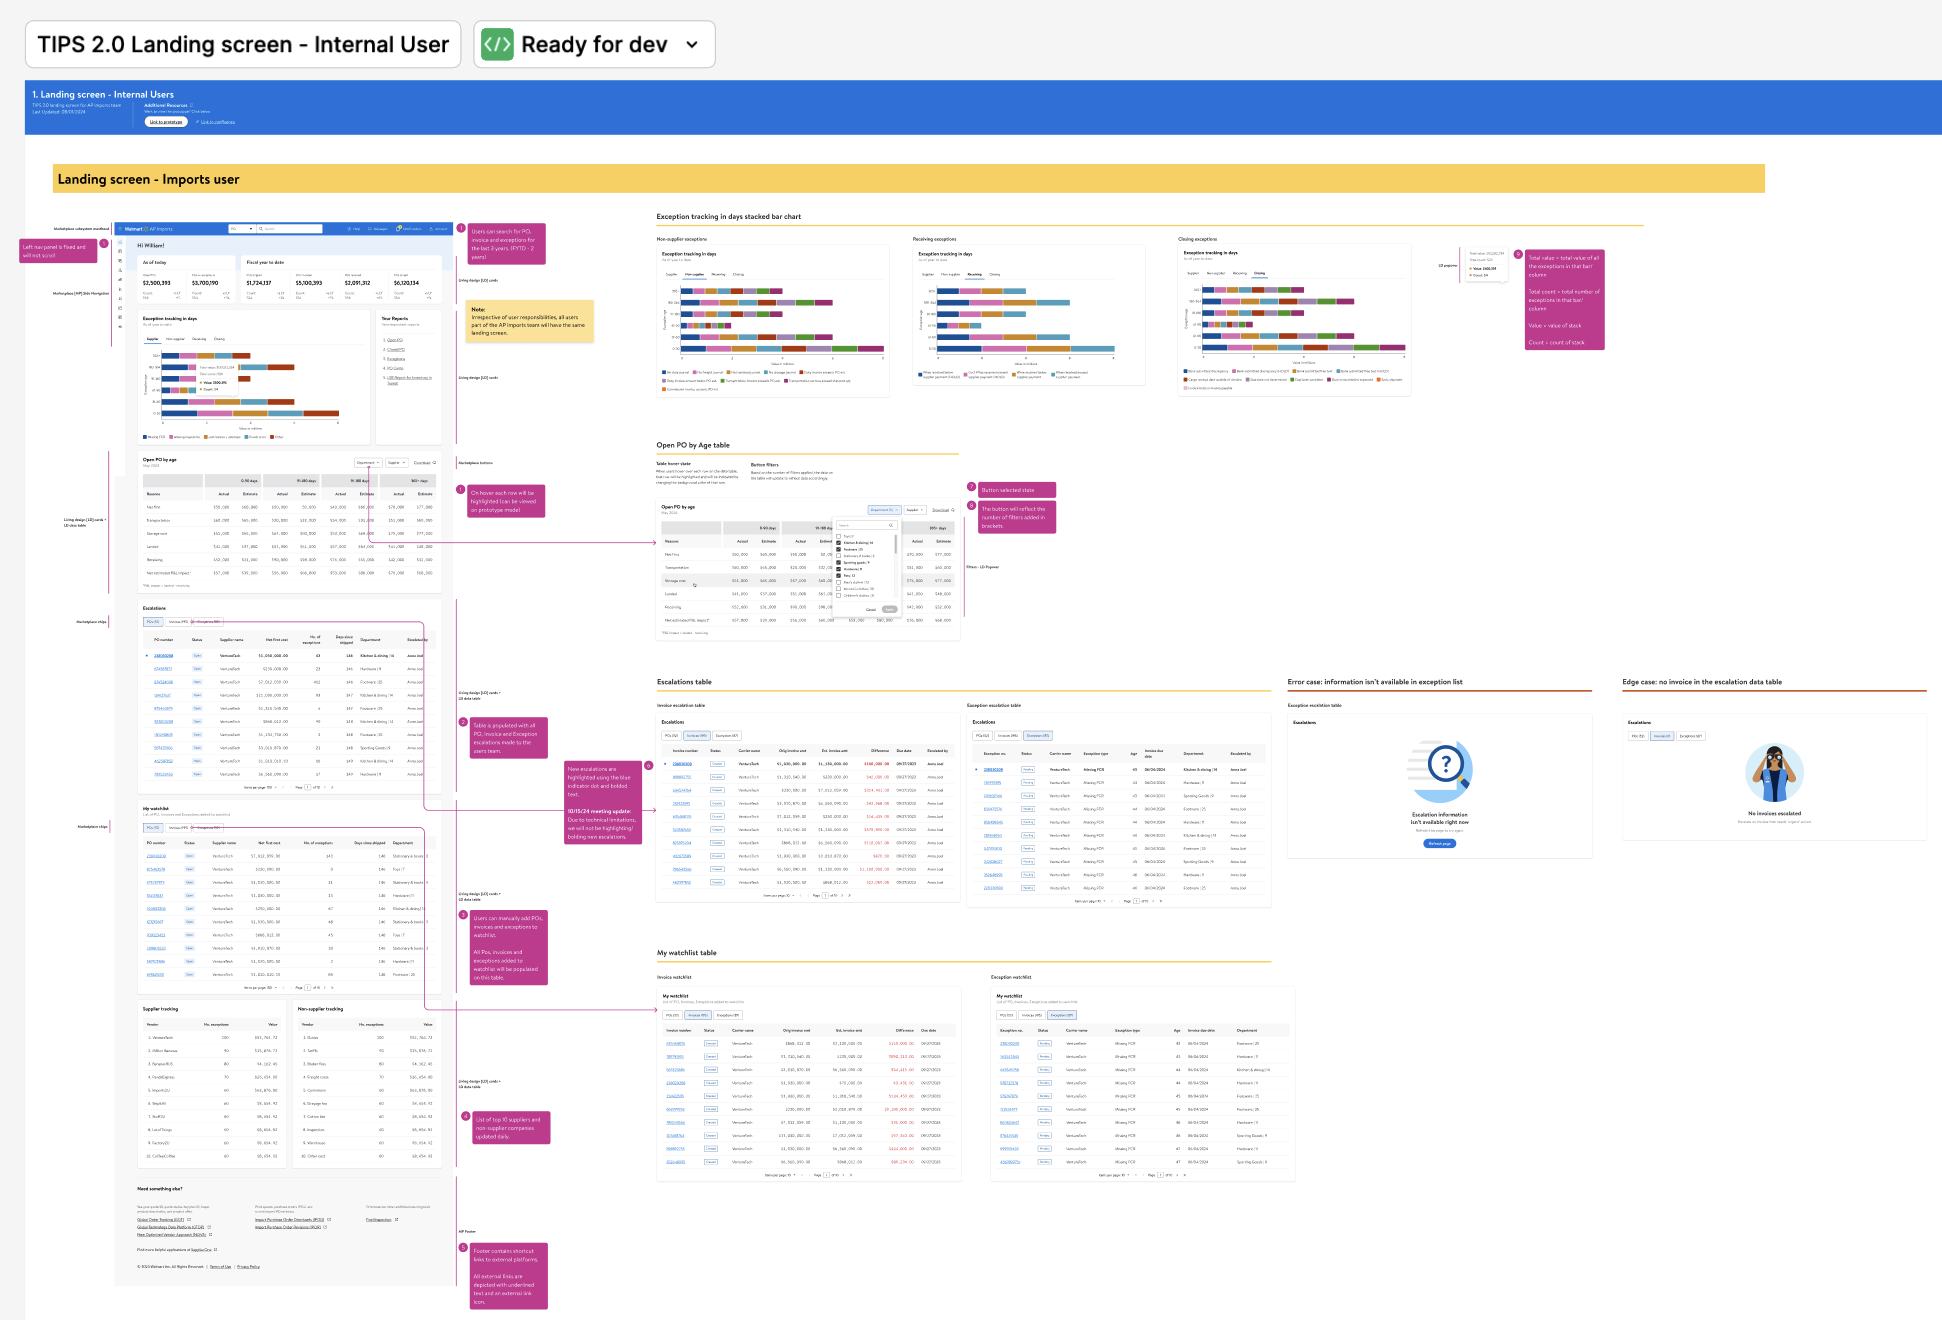
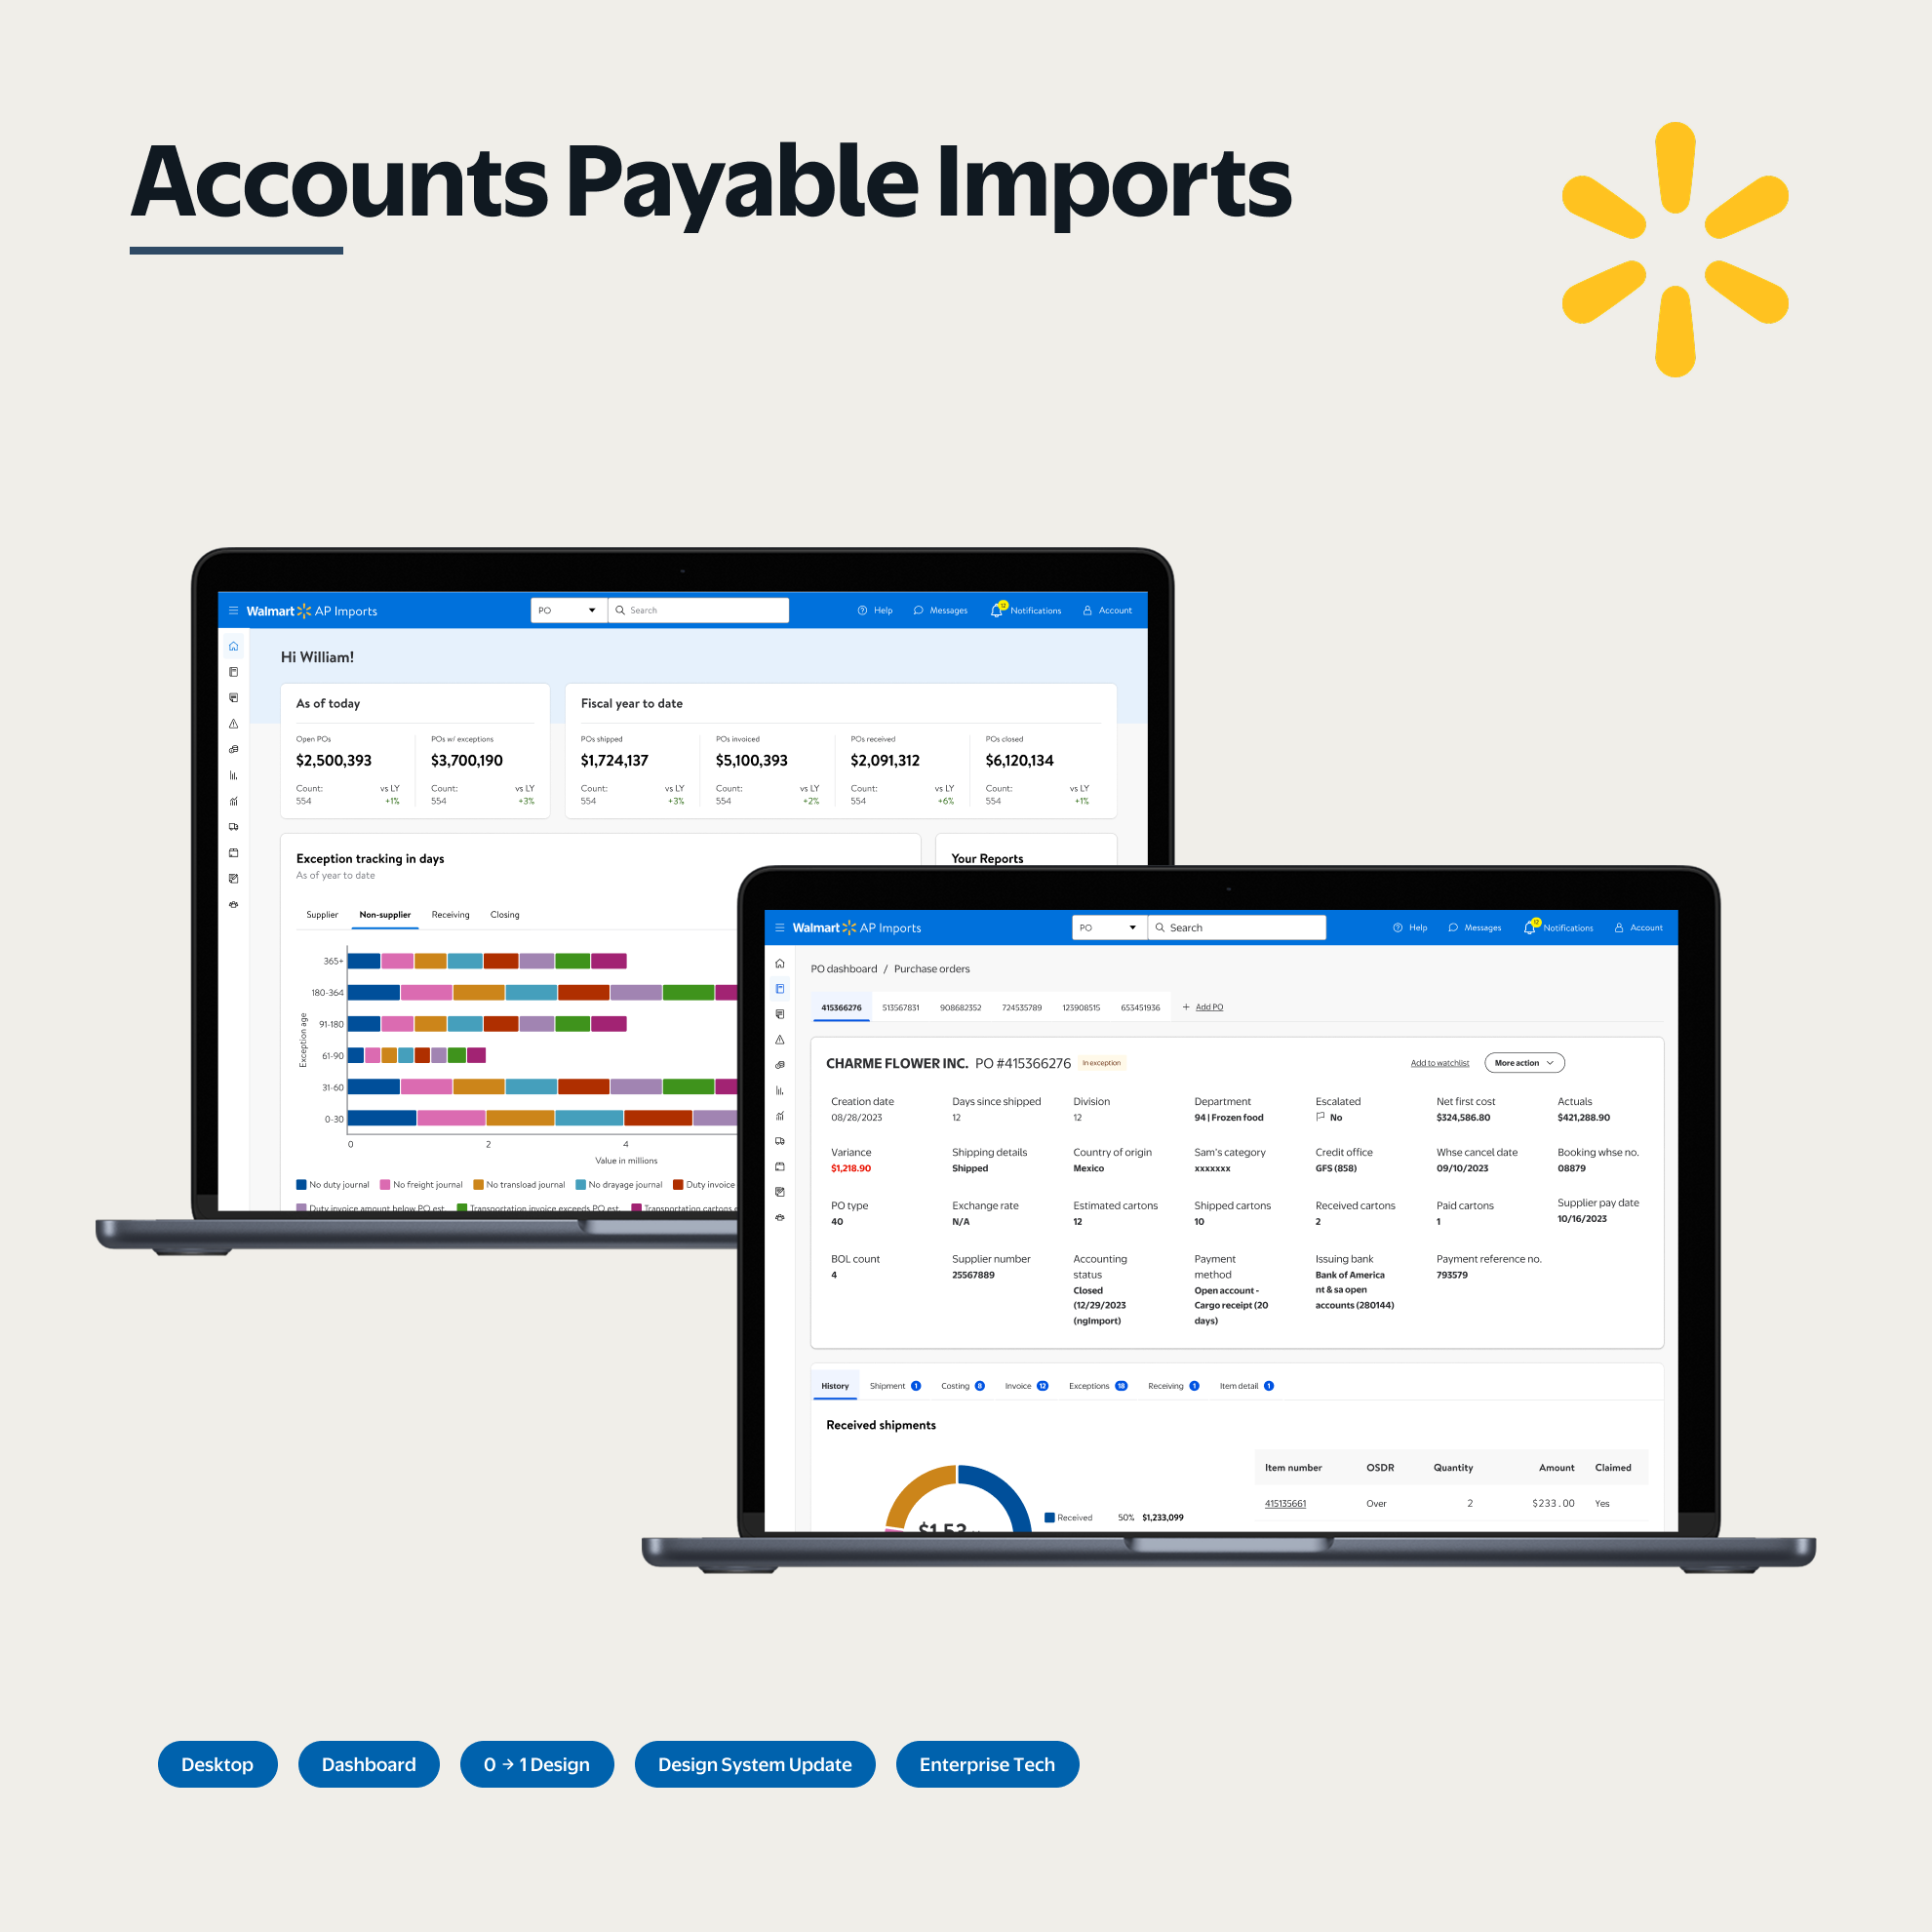
The research surfaced what no escalation report had: shadow workflows that had become the actual process. That finding reshaped what the redesign needed to do — not improve the tool, but earn back trust from users who had adapted around it. Navigation was restructured around task completion rather than data taxonomy. Exception states were elevated to where users needed them. Approval context was surfaced inline. Satisfaction went from 2.69 to 6.14 out of 7. The usability testing framework became the standard for the broader product area.
Research & discovery
End-to-end: discovery, stakeholder interviews, information architecture, three rounds of usability testing, final designs. The goal was understanding not just what was broken, but why it had stayed broken.
Methods
- Stakeholder interviews: Mapped the gap between what the business believed was happening and what users had actually built around the tool.
- Discovery research: Identified shadow workflows: the spreadsheets and manual checklists that had replaced the platform entirely.
- Three rounds of usability testing: Validated direction early and iterated against real task performance, not assumed pain points.
Key findings
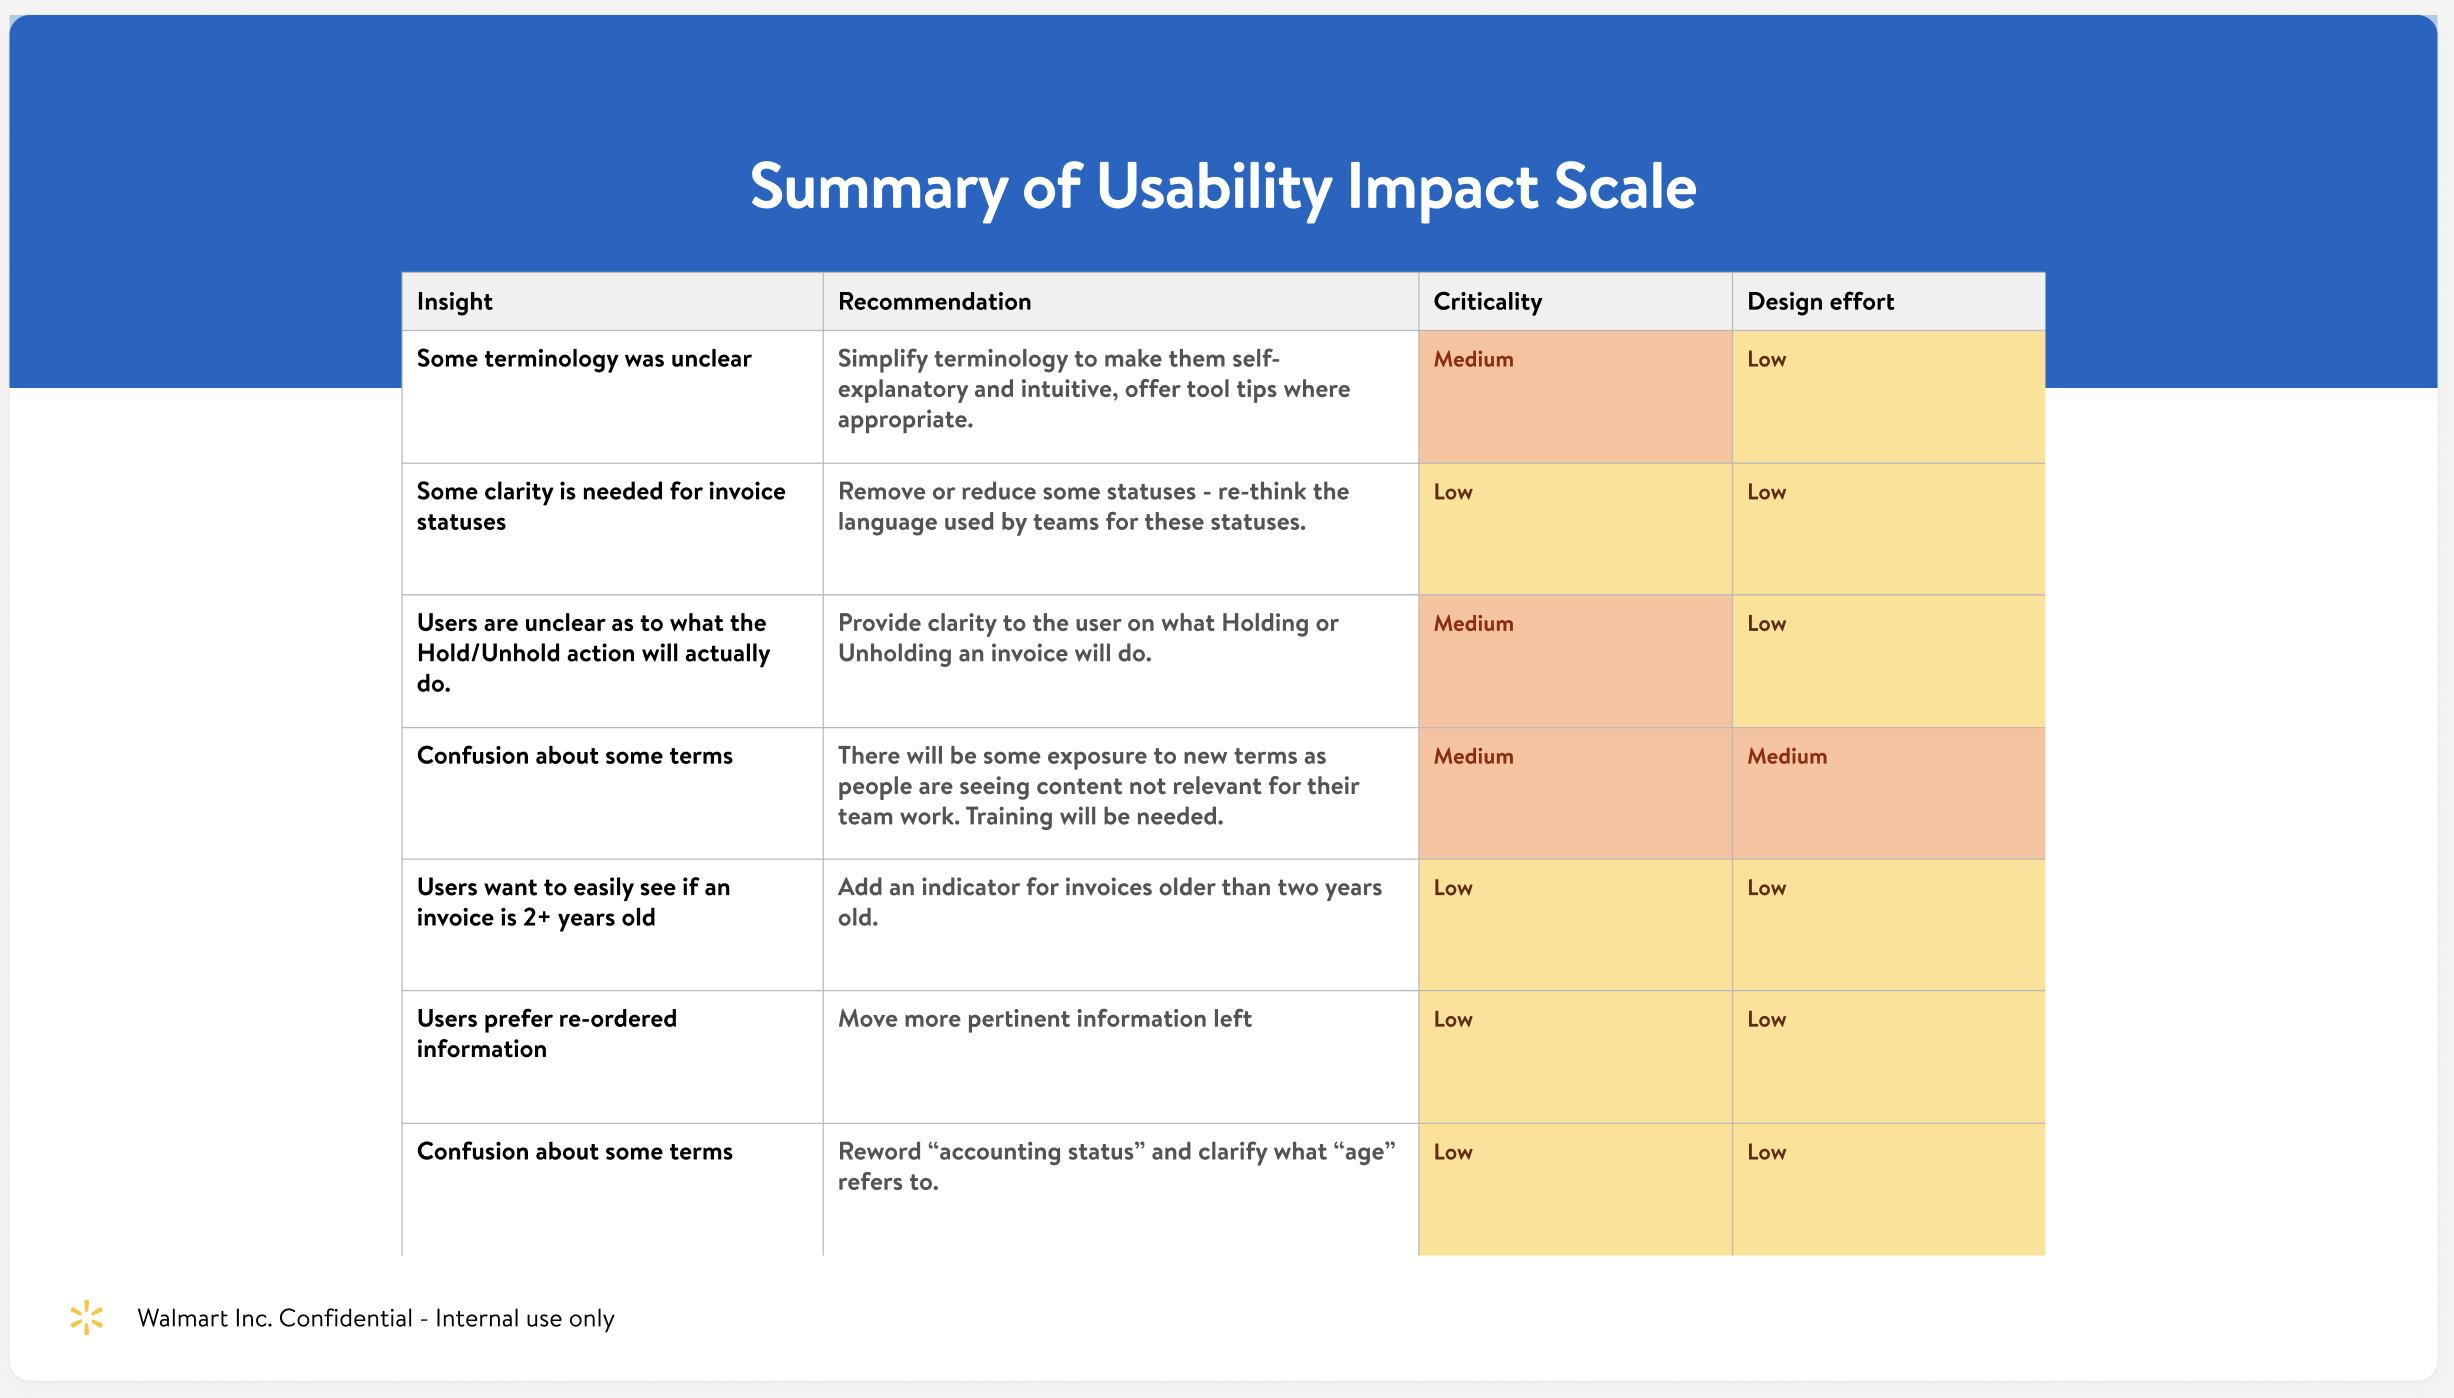
- The workarounds were invisible: Because users had adapted quietly, the business didn't see the problem. Escalation data understated severity significantly.
- Navigation was organized for the system, not the user: The existing IA reflected data taxonomy rather than task completion. Users had to learn the system's logic before they could do their job.
- Exception states were buried: The states users most needed to act on required hunting. The tool surfaced everything equally, which meant nothing was findable.
- Approval context was missing at the moment of decision: Approvers were being asked to make consequential decisions without the information they needed to make them confidently.
When I brought the discovery findings to the product team, the initial response was skepticism: the escalation data showed almost nothing, so how serious could the problem be? I had to make the case that a user who stops complaining isn't a satisfied user — they've adapted. Presenting the shadow spreadsheets side-by-side with the support ticket data made the gap concrete. Getting alignment that this needed a trust rebuild, not a feature increment, required three stakeholder sessions and a direct comparison of what the escalation record showed versus what the research surfaced.
Design process
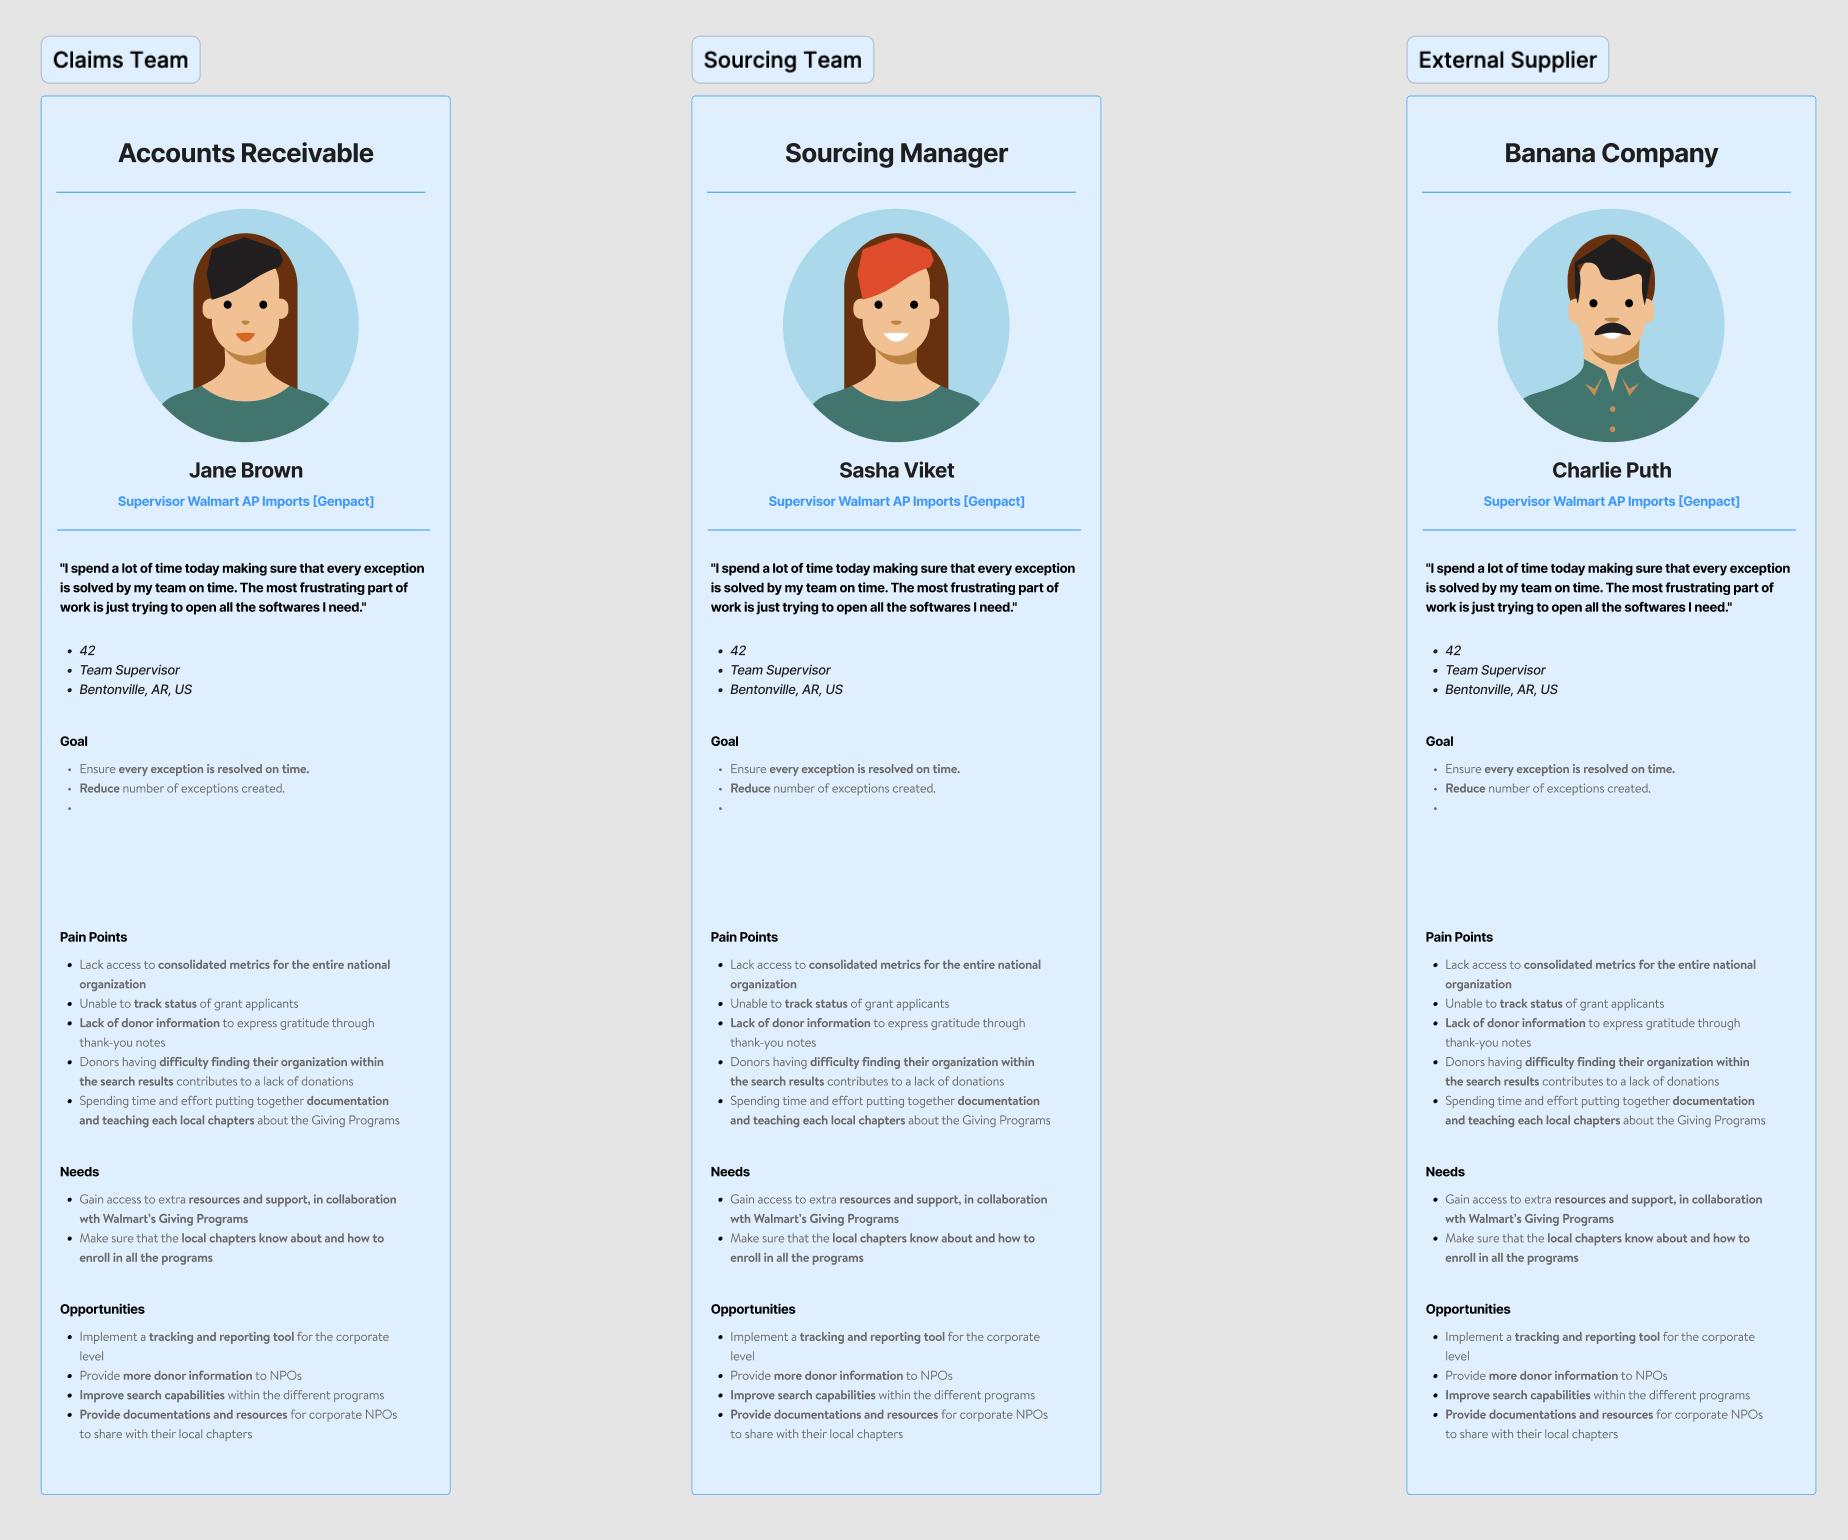
The central design challenge wasn't the UI. It was trust. Users had a conditioned belief that the system would fail them. Every design decision had to be evaluated against whether it would build or erode that belief.
Key design decisions
- Restructured navigation around task completion, not data taxonomy. Instead of asking users to understand how the system stored data, we organized views around what they were actually trying to accomplish: resolving exceptions, reviewing approvals, tracking reconciliation status.
- Elevated exception states. The states users needed to act on were surfaced at the top of their workflow, not buried in filtered views they'd have to configure each session.
- Surfaced approval context inline. Approvers got the history, flags, and rationale they needed to make a decision, without leaving the approval interface to find it elsewhere.